


CS2 skins act like tradable digital property: you can hold them, transfer them, and sometimes profit from price moves, but they are not regulated financial securities and their value depends on game demand and marketplace rules. Practical trading starts with consistent price tracking, spotting repeatable cycle patterns, and understanding liquidity so your exits do not get crushed by spread and slippage.
Common Myths About CS2 Skins as Assets
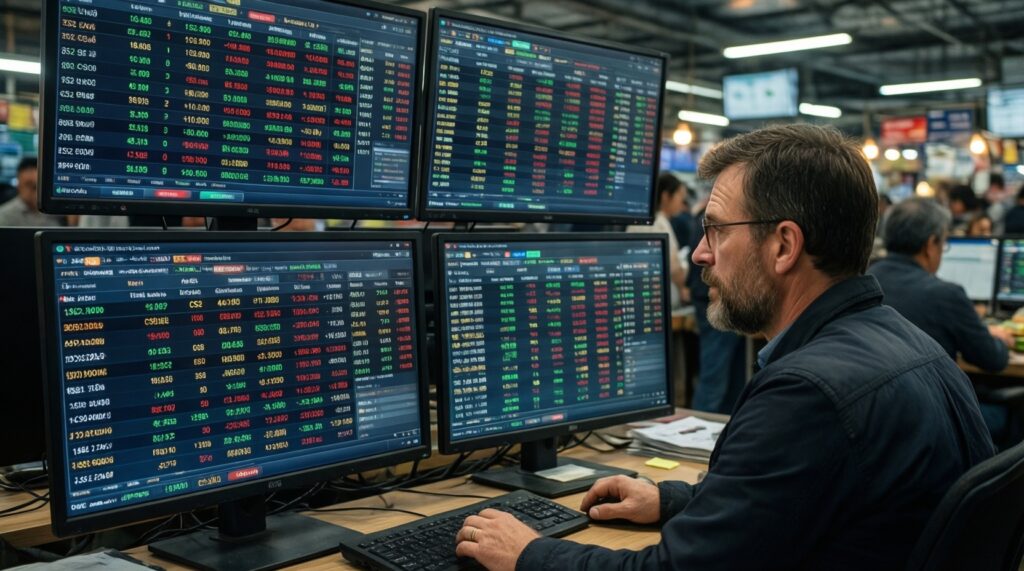
- Myth: "A skin always sells instantly at the listed price." Reality: execution depends on liquidity, market depth, and your price relative to live bids/asks.
- Myth: "One chart is enough." Reality: a cs2 skins price tracker can lag, smooth, or miss condition-specific listings; cross-checking sources reduces bad entries.
- Myth: "All skins in the same collection move together." Reality: float, wear tier, stickers, and supply concentration create separate micro-markets.
- Myth: "The cs2 skins market is purely random." Reality: recurring catalysts (updates, majors, streamer meta, case supply shifts) often create recognizable cycle phases.
- Myth: "If cs2 skins prices dipped, it must be manipulation." Reality: dips often come from normal inventory rotation, event-driven selling, or fee changes affecting net proceeds.
How CS2 Skins Function as Digital Property
A CS2 skin is a non-consumable in-game item whose ownership is tied to an account inventory and can be transferred through supported trading and marketplace mechanisms. In practice, it behaves like digital property because it is scarce relative to demand, has identifiable attributes (finish, wear/float, pattern, stickers), and can be exchanged for value.
Calling skins "assets" is useful for workflow and risk management, not because they provide legal guarantees. You do not get issuer disclosures, audited supply reports, or investor protections; you get platform rules, fees, and the willingness of other players to pay.
As a tradable item, a skin's "fair value" is usually a moving range rather than a single number. Your job is to estimate the range, then choose whether to buy cs2 skins for long holds, short flips, or inventory rotation-and to plan exits based on liquidity.
Mechanics of Price Tracking and Reliable Data Sources
- Track the right contract: record the exact skin variant (wear tier, StatTrak, and any special pattern/float rules). "AK-47 Redline (Field-Tested)" is not interchangeable with other conditions.
- Separate listing price vs. executable price: store both the lowest ask and the highest bid where possible; the tradable reality is the spread, not a single headline number.
- Use multiple references: pair at least one marketplace view with a cs2 skins price tracker view so you can detect stale prints and outlier listings.
- Normalize fees: compare net proceeds after platform fees and withdrawal friction; otherwise you will overestimate profit on paper.
- Log liquidity signals: note number of active listings, how quickly the top of book refreshes, and whether sales are clustered at one price step.
- Annotate catalysts: keep a simple event tag (update, tournament, case change, influencer spotlight) to connect price moves to drivers.
Identifying Market Cycles in CS2 Skin Prices
- Update-driven repricing: balance changes or visual updates can shift demand toward specific weapon types and finishes, producing a fast spike then consolidation.
- Tournament and content waves: majors, sticker seasons, and creator trends can rotate attention; you often see "leader skins" move first, then second-tier catch-up.
- Case supply shifts: when market attention moves to/away from a case, perceived future supply changes can create slow trends rather than sharp news spikes.
- Payday liquidity cycles: periodic inflows/outflows can tighten spreads briefly, then widen again as bids get filled and buyers step back.
- Seasonal inventory cleaning: players selling to fund new games or events can cause broad dips that recover unevenly depending on each item's depth.
Practically, you are not predicting the whole cycle-you are identifying where your item sits (impulse, markup, distribution, mean reversion) and matching position size and exit style to that phase.
Liquidity Factors That Determine Trade Speed and Slippage
Liquidity is what converts a "price" into an executable trade. Two skins can share similar chart history while behaving completely differently at exit because the order book and buyer pool are different.
What improves trade speed
- High buyer density: more active bidders near the current price reduces time-to-sell.
- Tight bid-ask spread: smaller spread means less "paid" to liquidity when you exit fast.
- Thick market depth: multiple bids at adjacent levels reduce slippage when selling more than one unit.
- Standardized variants: widely traded wear tiers typically clear faster than niche patterns that require a specific collector.
What creates slippage and "stuck inventory"
- Thin depth: a single aggressive sale can sweep the best bids and reprice the next executable level lower.
- Wide spreads: a large gap between bids and asks makes "mark-to-market" look better than real exit value.
- Attribute complexity: rare floats/patterns/stickers can be valuable but may require longer listing time or direct buyer matching.
- Platform constraints: holds, trading limits, payment methods, and region-specific cashout friction all reduce practical liquidity.
Risk, Valuation Methods, and Portfolio Implications
- Anchoring to the highest listing: valuing at the top ask instead of near executable bids leads to false confidence and late exits.
- Ignoring spread and fees: profit calculations must be done on net proceeds; otherwise "wins" disappear at sale time.
- Overfitting to one time window: short spikes can be noise; use multiple horizons (intraday, weekly, event-to-event) before sizing up.
- Concentration risk: holding many highly correlated items (same case/collection theme) can amplify drawdowns during broad selloffs.
- Assuming unlimited liquidity: scaling position size without checking market depth is how traders turn a small edge into a large slippage loss.
- Chasing "best" marketplaces: "best site to buy cs2 skins" depends on your goal (lowest net cost vs. fastest execution vs. safest settlement); treat it as a decision, not a slogan.
Practical Tools, Metrics Table, and a Sample Tracking Workflow
For intermediate traders, a lightweight system beats complex spreadsheets you never maintain. Your goal is a repeatable loop: capture clean item IDs, read the live market, record executable levels, and only then decide whether to list, hold, or rotate.
| Metric | What it tells you | How to measure quickly | Trading implication |
|---|---|---|---|
| Volume (recent sales activity) | How many real trades are happening | Check recent sales/history view on a marketplace; compare across days | Higher volume usually supports faster exits and tighter pricing |
| Spread (best ask − best bid) | Immediate cost of fast execution | Record top bid and top ask at the same timestamp | Wide spreads favor patient limit listing; tight spreads allow quicker flips |
| Volatility (range of moves) | How unstable pricing is around your entry | Track daily high/low range in your log or cs2 skins price tracker chart | Higher volatility demands smaller size and clearer exit rules |
| Market depth (bids near the price) | How much you can sell without moving price | Count bids within 1-3 price steps; note quantity at each step | Thin depth increases slippage; avoid oversizing |
A simple tracking loop you can run daily
- Define your watchlist: 10-30 items you understand (variants, wear tiers, and typical buyer base). Include your target entry and exit conditions.
- Snapshot the market: for each item, log best bid, best ask, approximate depth near best bid, and any obvious catalyst notes (patch, tournament, case chatter).
- Compute executable value: estimate "quick sell" value near bid and "patient sell" value near ask; subtract expected fees for both.
- Decision rule:
- If spread is tight and bids are thick, consider shorter holds or quicker rotations.
- If spread is wide but depth is stable, list patiently and avoid panic repricing.
- If depth collapses after a catalyst, reduce size or delay entries until bids rebuild.
- Review weekly: compare your executed trades vs. your recorded executable levels to see where your process is optimistic or too conservative.
When you're ready to buy cs2 skins, use the workflow above to decide whether the current cs2 skins prices reflect real executable demand in the cs2 skins market, not just attractive listings.
Straight Answers to Frequent Trading Doubts
Is a cs2 skins price tracker enough to trade confidently?
No-use it for trend context, then verify live bids/asks and depth on the marketplace where you will actually trade.
What matters more: the lowest ask or the highest bid?

The highest bid is closer to your fast-exit value; the lowest ask is closer to a patient sale. Your plan should explicitly choose which one you are targeting.
How do I choose the best site to buy cs2 skins?
Pick based on your priority: lowest net cost after fees, fastest execution, or simplest settlement. Then test with small trades to validate spreads and real sell-through.
Why do my skins look up on charts but sell below my expectation?
You are likely anchoring to asks while the executable bids are lower, or you are hitting thin depth and creating slippage.
Do market cycles mean I should always wait for dips?
No-cycles help you size and time entries, but missed trades are common if you only wait. Use depth and spread to decide whether current pricing is tradable.
Are rare patterns and sticker crafts better "investments"?
They can have higher upside but usually lower liquidity. Treat them as slower-moving positions and plan longer listing times.