


RNG in loot mechanics is the method games use to turn a random number into an item outcome, typically expressed as drop rates and often modified by systems like pity timers. To evaluate or design it, you need to connect RNG implementation to probability, then compare pure RNG vs pity variants by expected value, player risk, and engineering risk.
Myths vs Reality: Quick Corrections on RNG and Loot
- Myth: A 1% drop means you will get the item within 100 tries. Reality: each attempt is usually independent; 100 tries only changes the cumulative chance, not a guarantee.
- Myth: Players are "due" after a long dry streak. Reality: without a pity system, past misses typically don't affect future odds.
- Myth: Publishing one drop rate fully describes fairness. Reality: fairness depends on the whole distribution (tails), not only the average.
- Myth: A pity timer is always more player-friendly. Reality: some pity designs can feel manipulative if the rules are opaque or if they shift value between segments.
- Myth: "True random" is automatically the best implementation choice. Reality: true randomness can be a UX problem; controlled randomness can reduce frustration but increases design and compliance risks.
Common Misconceptions About Drop Rates
In rng loot mechanics drop rates, a "drop rate" is a mapping from an attempt (kill, chest, pull, craft) to a probability distribution over outcomes. The key boundary: the rate is only meaningful relative to the rules of attempts (independent or stateful), and relative to the pool (what else can drop and how weights change).
Many debates about "rigged" loot come from mixing three different concepts: (1) the per-attempt chance, (2) the cumulative chance after N attempts, and (3) a guarantee mechanism (pity, token exchange, deterministic craft). These produce very different player experiences even if the headline probability looks similar.
Another common confusion is between RNG generation and RNG usage. Most games use a pseudo-random generator; perceived unfairness is more often caused by how random values are consumed (tables, weights, pity counters, segmentation) than by the generator itself.
Probability Fundamentals: From RNG to Drop Chance

At runtime, RNG is typically used as "roll a number, compare to thresholds, select an outcome." To make this designable and testable, treat it as a probability model first, and as code second.
- Independent trials: if each attempt has the same probability p and no state, the chance of at least one success in N tries is 1 - (1 - p)^N.
- Weighted tables: outcomes have weights; probability is w_i / sum(w). Changing any weight changes every other probability.
- Stateful modifiers: counters, streak logic, "first-of-day" boosts, and pity timers make the process non-independent.
- Conditional pools: the loot pool may differ by level, region, banner, or difficulty; "drop rate" must specify the pool context.
- Multiple rolls per attempt: one chest may roll "rarity" then "item," or do multiple independent sub-rolls; you must combine probabilities across stages.
- Replacement vs no replacement: draws "without replacement" (e.g., a finite deck) behave differently than repeated independent pulls.
If you're documenting how to calculate drop rates in games, always state: (a) what constitutes an attempt, (b) whether attempts are independent, and (c) whether any state or pool changes exist.
Pity Timers: Design Variants and Their Statistical Effects
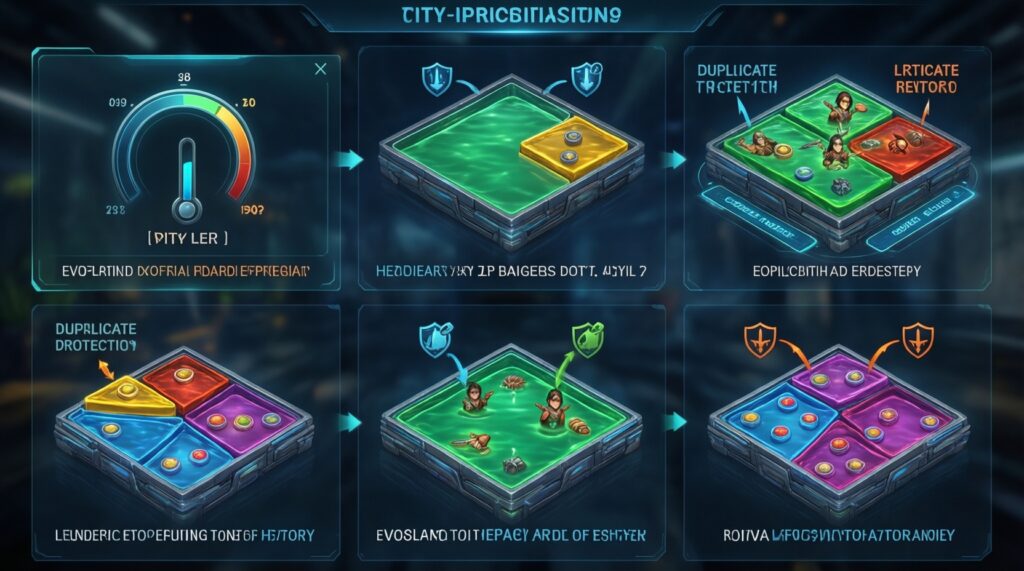
A pity timer system explained is any mechanic that increases the chance of a desired outcome as a player fails repeatedly, typically to cap the worst-case experience. In practice, pity is common in gacha drop rates and pity timer implementations, but it also appears in dungeon drops, event rewards, and crafting streak protection.
- Hard pity (deterministic guarantee): after K failures, the next attempt guarantees success. Effect: caps the tail; easiest to message; can strongly shape spending behavior.
- Soft pity (increasing probability): probability increases after some threshold and ramps up. Effect: reduces dry streaks without a single "cliff," but is harder to explain and validate.
- Pseudo-random distribution (PRD): uses a tuned curve so short streaks are less likely while long-term average stays near target. Effect: smooths perception, but can be difficult to audit.
- Token/fragment pity: each attempt grants currency; enough currency guarantees the item. Effect: transparent EV; adds economy design and inventory complexity.
- Duplicate protection: reduces chance of already-owned items. Effect: increases completion rate; changes value for different player cohorts.
Implementation risk rises as pity becomes more stateful and segmented (e.g., per-banner counters, per-item counters, shared counters across pools). That added state increases debugging cost and makes analytics attribution harder if not designed upfront.
Calculating Expected Value for Loot Systems
Expected value (EV) is the average outcome over many trials; it is useful for pricing, tuning, and comparing systems, but it does not describe frustration from unlucky tails. For an intermediate designer, EV is the bridge between "the rate feels okay" and "the economy will survive."
What EV is good for
- Costing rewards: average number of pulls for a target reward (or value) helps set prices and sinks.
- Comparing designs: pure RNG vs soft pity vs hard pity can have similar EV but very different worst-case experiences.
- Detecting hidden value shifts: duplicate protection can raise EV for completionists while lowering perceived value for early-game players (or vice versa), depending on the pool.
What EV misses (and what to add)

- Tail risk: players don't live at the mean; measure percentiles (e.g., "how many pulls for 90% of players").
- Segment effects: different cohorts interact with pools differently; average EV can hide winners and losers.
- Rule complexity cost: stateful systems increase QA surface area, exploit risk, and customer support burden.
If you want an expected value loot boxes calculator, the minimal viable version should compute at least: EV of value per pull, probability of getting the target by N pulls, and a "worst-case cap" if hard pity exists.
Practical Tools and a Comparative Table: Simulation, Analytics, and Tuning
Comparing approaches by implementation convenience and risk is easiest when you list what each approach requires: state, messaging, telemetry, and testing. Below is a practical comparison you can use during design reviews.
| Approach | How it works | Implementation convenience | Player-perceived risk | Design/ops risk | Best use cases |
|---|---|---|---|---|---|
| Pure RNG (independent p) | Same chance each attempt; no memory | High (simple code, minimal state) | High tail risk; long dry streaks possible | Lower tech risk; higher UX/support complaints | High-frequency drops, low-stakes rewards |
| Hard pity (guarantee at K) | Track failures; guarantee on/after K | Medium (needs persistent counter and reset rules) | Lower tail risk; clearer expectation | Messaging/legal/compliance sensitivity; exploit risk if resets are unclear | Premium targets, banner systems, monetized pulls |
| Soft pity (ramp-up curve) | Increase p after threshold; cap near guarantee | Medium-Low (more tuning, more edge cases) | Medium; feels better than pure RNG if communicated | High tuning/QA risk; easy to mis-implement curve | When you want fewer extremes without a single hard cap |
| Token pity (earn toward guarantee) | Each attempt grants currency; redeem at cost | Low-Medium (economy + UI + inventory) | Low; progress is visible and predictable | Economy inflation, pricing mistakes, secondary market/exchange issues | Long-term progression, seasonal events, retention loops |
Common engineering and design mistakes to catch early
- Probability drift: soft pity curve changes the long-run average more than intended because the ramp is not normalized.
- Counter scope bugs: pity tracked per-banner vs global vs per-item creates unexpected carryover or resets.
- Pool changes without recalculation: adding items changes effective rates and duplicate rates; EV shifts silently.
- Telemetry gaps: you can't audit fairness if you don't log roll context (pool ID, pity state, seed/version).
- Ambiguous messaging: players interpret "increased chance" as "guaranteed soon," creating support burden.
Minimal simulation snippets (pseudocode)
1) Pure RNG simulation (estimate distribution)
function simulate_pure_rng(p, trials, runs):
  results = []
  for r in 1..runs:
    count = 0
    while true:
      count += 1
      if rand01() < p:
        results.append(count)
        break
      if count == trials:   # optional cutoff
        results.append(trials + 1)
        break
  return results
2) Hard pity simulation (guarantee at K)
function simulate_hard_pity(p, K, runs):
  pulls_to_hit = []
  for r in 1..runs:
    misses = 0
    pulls = 0
    while true:
      pulls += 1
      if misses >= K:        # guarantee condition (define carefully)
        pulls_to_hit.append(pulls)
        break
      if rand01() < p:
        pulls_to_hit.append(pulls)
        break
      misses += 1
  return pulls_to_hit
3) Soft pity curve (illustrative ramp)
function p_soft(baseP, pullIndex, startRamp, maxP):
  if pullIndex < startRamp:
    return baseP
  t = pullIndex - startRamp
  return min(maxP, baseP + t * 0.01)  # tune slope; don't hardcode in production
Actionable checklist before launch
- Define attempt boundaries and pool IDs (what exactly is a "roll").
- Write the mathematical spec first (independent vs stateful; pity scopes; reset conditions).
- Decide what you will disclose to players, and keep it consistent with actual logic.
- Log enough context to audit outcomes (pool, pity state, version).
- Test with simulation: average, percentiles, and worst-case under every pool configuration.
Balancing Player Experience: Fairness, Retention, and Economic Outcomes
Convenience and risk often pull in opposite directions: pure RNG is easiest to ship but creates the largest tail-risk complaints; token pity is most predictable for players but adds economy and UI complexity; soft pity can be a sweet spot but is fragile if your telemetry and tuning workflow are immature.
Mini-case: choosing between pure RNG and hard pity
Suppose a premium item has base chance p per pull. A hard pity at K turns "unbounded worst-case" into a strict cap, which reduces churn from extreme unlucky streaks, but it also creates a predictable ceiling that players can plan around and that your economy must absorb.
# Decision sketch: pick K by acceptable worst-case, then tune p for revenue/EV
# Inputs: target_percentile_pulls, acceptable_max_pulls (K), ARPU constraints, support load
if support_load_from_dry_streaks is high:
  implement = "hard pity"
  K = acceptable_max_pulls
  tune p downward/upward to keep long-run value stable
else:
  implement = "pure RNG"
  invest in clear disclosure + make the item non-blocking for progression
Practical Clarifications on RNG Mechanics
Are "rng loot mechanics drop rates" usually independent?
Not always. Many modern systems are stateful (pity, duplicate protection, segmented pools), so the per-attempt chance can depend on history or player state.
What is the simplest "pity timer system explained" definition?
A pity timer is a rule that increases your chance or guarantees the desired result after enough unsuccessful attempts, reducing worst-case outcomes.
Do "gacha drop rates and pity timer" systems change the published base rate?
They can. Some keep the base rate constant and only add a guarantee; others effectively increase the average rate due to ramping, unless tuned to compensate.
Can an "expected value loot boxes calculator" prove a system is fair?
No. EV can match while player experience differs drastically due to tail risk; you also need percentiles and clear rules about pools and resets.
What's the fastest way for an intermediate dev to learn "how to calculate drop rates in games" correctly?
Write a spec with the exact roll sequence and pool, then validate it with a Monte Carlo simulation and telemetry from a staging environment.
Is soft pity always better than hard pity?
No. Soft pity is harder to explain and easier to mis-implement; hard pity is clearer but can create strong behavioral thresholds that affect monetization and sentiment.