


Loot box drop rates are the published probabilities that each reward (or reward tier) appears per opening, and transparency matters because it lets players interpret expected outcomes, compare value, and spot misleading designs. To read a loot box probability table correctly, you must distinguish per-open odds, cumulative chance across multiple opens, and conditional chances after guarantees or pity systems.
Core Concepts: Loot Box Probability at a Glance
- Per-open probability is the chance on one independent opening (for example, 1% = 1/100 per open).
- Cumulative chance answers "at least one success in N opens," which is higher than the single-open chance.
- Conditional chance changes when rules apply (pity timers, guaranteed drops, tier upgrades).
- "Odds" vs "rates": loot box odds are often communicated as rates; "1 in 100" and "1%" are the same per open.
- Transparency reduces risk for players and publishers by making expected outcomes auditable.
How Loot Box Mechanics Translate to Drop Rates
"Loot box drop rates" describe how the game's reward selection system maps each possible outcome to a probability on a single opening. Typically, a loot box first chooses a tier (common/rare/epic), then chooses an item within the tier, so the final per-item chance is the product of both steps.
Drop-rate disclosures can be honest yet still confusing if they omit the selection path (tier-then-item), bundle items into broad categories, or fail to state whether the rates are constant over time. When you see loot box odds in a notice or store page, confirm whether they apply to every opening, only to specific box types, or only during a promotion.
Boundaries matter: a published rate can only be interpreted if you know (1) what counts as an "open," (2) whether duplicates are allowed, and (3) whether any protection systems (guarantees/pity) modify the effective probability after repeated opens.
Reading Probability Tables: Rows, Columns and Cumulative Chance
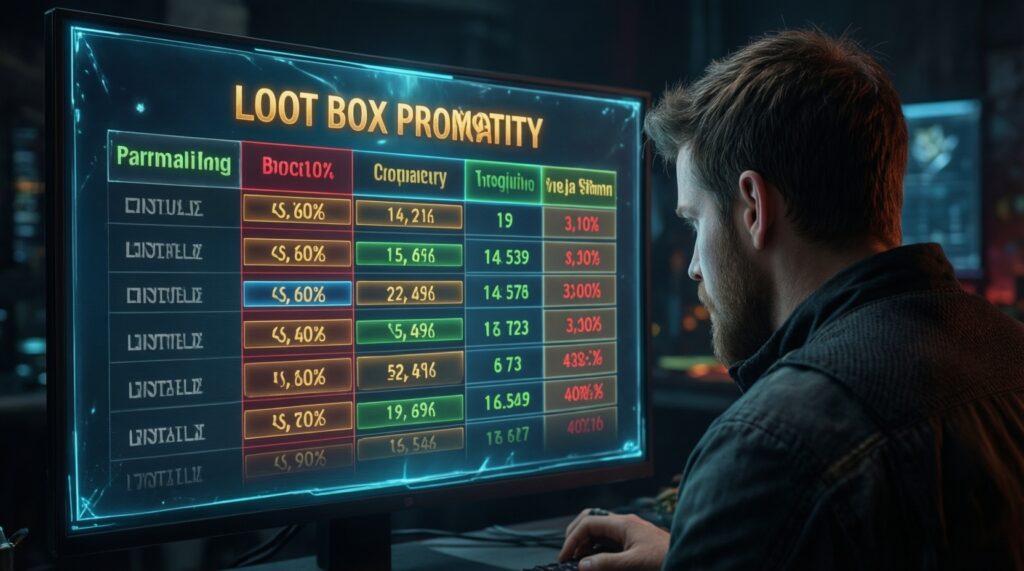
A loot box probability table should let you reconstruct both per-item rates and the player-relevant "how likely is it after N opens?" outcomes. Use the table below as a model for what to look for and how to interpret each column.
| Outcome (example) | Per-open drop rate | Per-open odds (fraction) | Cumulative chance after 10 opens (at least one) | Conditional chance with a guarantee (example rule) |
|---|---|---|---|---|
| Legendary item (any) | 1% | 1/100 | ~9.6% | If "guaranteed by 100 opens": 100% by the 100th open (not 1% per open anymore) |
| Epic item (any) | 5% | 1/20 | ~40.1% | If "pity increases after misses": chance may rise above 5% on later opens |
| Rare item (any) | 20% | 1/5 | ~89.3% | If "no-duplicate protection": conditional chance can shift toward unowned rares |
| Specific Legendary A (within Legendary tier) | 0.25% (example: 1% tier × 25% within tier) | 1/400 | ~2.5% | If "guaranteed Legendary is random": guarantee may still not target A |
- Check what the rate is "per." It should be per opening of a specific loot box type, not "per purchase session" or "per day."
- Confirm whether rates are tier-level or item-level. "1% Legendary" is not the same as "1% for the Legendary you want."
- Convert loot box odds consistently. 0.5% = 1/200; 2% = 1/50. Mixing formats causes misreads.
- Compute cumulative chance for real expectations. For a constant per-open chance p, the chance of at least one success in N opens is 1 − (1 − p)^N.
- Identify conditional columns. Any "guaranteed after X," "pity," "streak bonus," or "no-duplicate" rule means the effective probability is not constant.
- Look for rounding and aggregation. Tables may round small rates (for example, showing "0%") or group items ("featured pool"), hiding the per-item truth.
Common Statistical Models Behind Drop Algorithms

Publishers can implement the same headline loot box drop rates using different underlying models. Comparing approaches by implementation convenience and risk helps explain why transparency is hard-and why partial disclosures are common.
-
Independent Bernoulli per open (constant p).
Easy to implement: simple RNG check each open. Risk: players misjudge streaks; without a clear table, perceived unfairness spikes during unlucky runs. -
Two-stage selection (tier → item).
Convenient for content updates: add items inside tiers without rewriting the whole distribution. Risk: disclosure often shows only tier rates, making per-item probabilities non-obvious. -
Weighted pool with rotating "featured" items.
Operationally convenient: marketing can swap weights per event. Risk: frequent changes require frequent updates to the loot box probability table; otherwise it becomes stale or misleading. -
Pity timer (increasing chance after misses).
Player-friendly outcomes: reduces extreme bad luck. Risk: hard to describe succinctly; a single "drop rate" number is incomplete without the conditional schedule. -
Guarantee at N (hard pity).
Straightforward to explain: "guaranteed by N opens." Risk: can still hide the odds of a specific item (guarantee may be any Legendary, not the featured one). -
No-duplicate / collection-based protection.
Good for completion: probabilities adapt to inventory state. Risk: rates become account-dependent; static disclosures can't represent everyone's conditional chance.
Regulatory and Ethical Reasons for Transparency
Transparency is not only about being "nice." It directly affects consumer understanding, perceived fairness, and the ability to make informed decisions before you buy loot boxes. It also reduces the chance of disputes when outcomes don't match expectations.
Benefits of clear disclosures (low friction, lower disputes)
- Improved decision quality: players can compare loot box odds across box types and events instead of relying on hype.
- Lower reputational risk: clear, current tables reduce accusations of "shadow nerfs" or bait-and-switch.
- Better support outcomes: fewer complaints driven by misunderstandings of cumulative vs per-open chance.
- Cleaner product design: teams must define and document probability logic, which reduces internal errors.
Limits and risks (implementation cost, misinterpretation, exploitation)
- Hard to express conditional systems: pity and inventory-dependent logic can't be captured by one percentage.
- Rounding and localization issues: small rates may be displayed imprecisely, creating "0%" impressions.
- Targeting concerns: detailed odds can encourage highly optimized spending strategies, which some teams view as undesirable.
- Operational overhead: rotating pools require constant updates; outdated tables undermine trust more than no table.
Case Studies: Interpreting Real-World Drop Rate Tables
- Mistaking tier rate for item rate. "1% Legendary" may still mean "0.1% for the featured Legendary" depending on how many legendaries share the tier.
- Assuming cumulative chance grows linearly. Ten opens at 1% is not 10%; it's 1 − 0.99^10 (~9.6%).
- Ignoring conditional rules. A pity system means the first open and the 80th open can have different probabilities even if the published headline rate stays the same.
- Confusing "guaranteed by N" with "guaranteed on the Nth." "By 100" usually means any time up to and including the 100th, not specifically at exactly 100.
- Overreading "featured" labels. "Featured" can mean higher weight, separate pool, or just marketing; only the loot box probability table clarifies which.
- Using anecdotal streaks as proof. Short runs (good or bad) do not validate or invalidate loot box drop rates without a defined test plan and enough samples.
Practical Steps to Verify Publisher-Provided Rates
You can't fully audit server-side RNG from the outside, but you can validate whether your observations are broadly consistent with the published loot box odds, and you can detect obvious inconsistencies (wrong pool, outdated table, missing conditional rules).
A lightweight "sanity check" method (intermediate, low tooling)
- Record the exact box type and version. Event boxes, banners, and regions can differ; don't mix them.
- Capture outcomes in a structured log. Include date/time, box name, and reward tier/item.
- Compare observed frequency to expected frequency. If the table says 5% Epic, then over many opens you expect Epic counts roughly near 5% (with variance). Large deviations may indicate you logged the wrong pool or rules.
- Account for conditional mechanics. If there's pity/guarantee, segment your data by "open index since last hit" rather than pooling everything.
Mini pseudo-code for a simple loot box drop rate calculator
The following shows how to compute the cumulative chance of at least one success, given a constant per-open probability p. This is the core of many "loot box drop rate calculator" tools:
# Inputs:
# p = per-open probability as a decimal (e.g., 0.01 for 1%)
# N = number of opens

cumulative = 1 - (1 - p) ^ N
return cumulative
Self-check list for interpretation and verification
- Did I separate tier odds from per-item odds before concluding anything?
- Did I compute cumulative chance for my real number of opens instead of multiplying p × N?
- Did I identify any conditional rules (pity, guarantee, no-duplicate) that change the effective probability?
- Did I confirm the probability table is current for my region (TH) and event before I buy loot boxes?
- Did I log outcomes consistently enough to compare against the published loot box drop rates?
Quick Clarifications and Common Misconceptions
Are "loot box drop rates" and "loot box odds" the same thing?
Often yes: odds are just another way to express the same per-open probability (1% equals 1/100). Differences appear when "odds" are used loosely while conditional mechanics are present.
Does a 1% rate mean I will get the item after 100 opens?
No. 1% per open means each open has a 1/100 chance; it does not guarantee a hit after 100 opens unless there is an explicit guarantee.
Why is a loot box probability table sometimes only tier-based?
Tier-only tables are easier to maintain when items rotate inside tiers. The tradeoff is reduced clarity for per-item chances, especially for featured items.
If I'm unlucky for a long time, am I "due" for a win?
Not under an independent model with constant probability. You are only "due" if a pity or guarantee system explicitly changes the conditional chance.
Can a publisher change rates without changing the displayed table?
Technically they can change server-side logic, but that creates trust and support risk. Players should treat unclear update histories as a reason to be cautious.
Is a "guaranteed Legendary" the same as "guaranteed featured Legendary"?
No. A guarantee may apply to a tier, not to a specific item, so the featured target can remain rare even with a guarantee.
Should I rely on a third-party loot box drop rate calculator?
Use calculators for math (cumulative chance, conversions), not as proof of the true rates. The input must match the game's actual per-open and conditional rules.