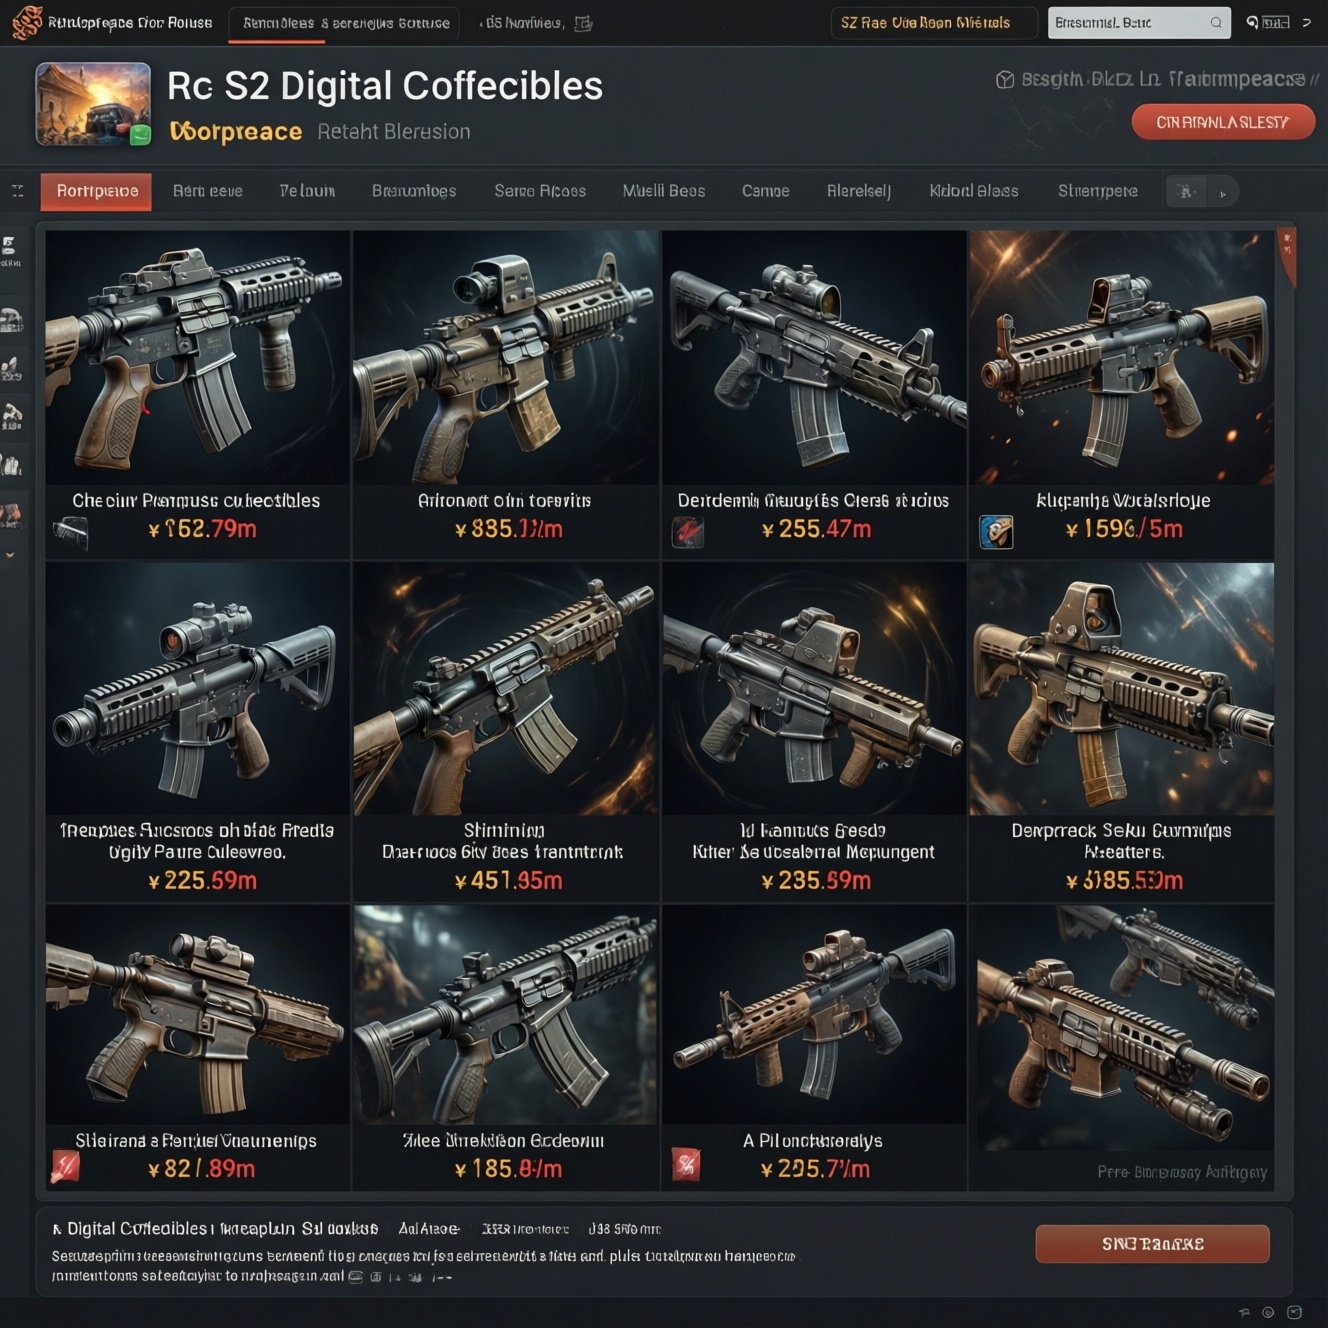

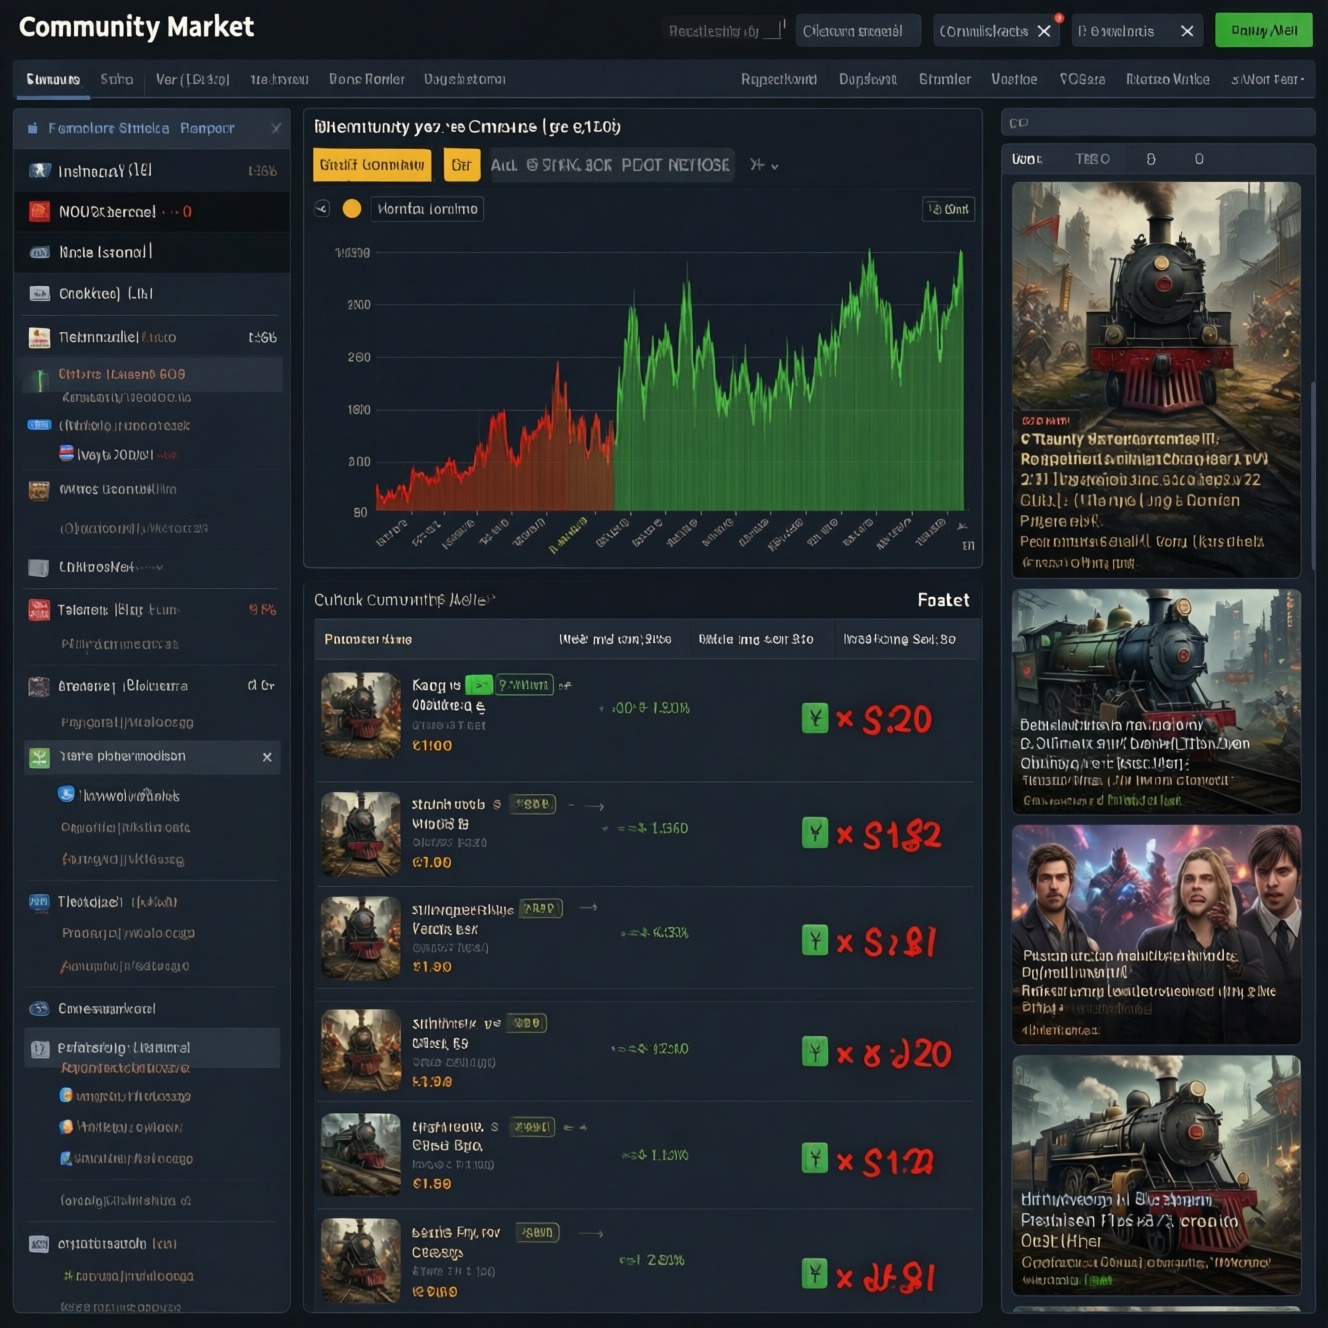
Steam Community Market item prices move because supply (how many tradable listings exist and how fast new items enter) meets demand (players wanting to use, collect, or speculate). To spot steam market item price trends early, watch volume, listing depth, and volatility, then connect spikes to updates, esports moments, or seasonal buying cycles.
Core Drivers of Steam Item Prices
- Supply flow: drops, crafting, case openings, trade holds, and temporary listing surges.
- Demand pulses: events, new content, streamer attention, and "complete-the-set" collecting.
- Quantified scarcity: rarity tiers, float ranges, pattern IDs, StatTrak, and condition brackets.
- External catalysts: patches, esports results, bans, and real-money trading pressure.
- Market microstructure: liquidity, fee drag, buy/sell spread, and psychological price floors.
How Supply Mechanics Shape Market Value
On the Steam Community Market, "supply" is not just total items in existence; it is the tradable, listable inventory actively competing at current prices. A skin can be common overall but "scarce" on-market if many copies sit in long-term inventories, are locked by trade holds, or are concentrated among collectors.
Supply mechanics also include how new units are minted (drops, crafting, case openings) and how quickly sellers undercut (listing behavior). When new supply arrives in a predictable wave, prices often drift down until demand absorbs the extra listings; when supply is interrupted, prices can jump even without new demand.
Mini-scenario (TH context): You wake up and see a sudden flood of new listings for a Dota 2 cosmetic at slightly lower prices. A regional evening peak can amplify undercutting as more sellers list after playtime, temporarily pushing steam community market prices down even though nothing "fundamental" changed.
- Watch for: a sharp rise in listing count at the same price band.
- Watch for: repeated undercuts of small increments (fast seller competition).
Demand Signals: Player Behavior and Seasonal Effects
Demand is shaped by use-value (players equipping items), collection-value (set completion), and speculation (buying for resale). The strongest demand signals are behavior changes you can observe indirectly via trades, listings, and price/volume patterns.
- Update-driven utility: a buff/nerf shifts what players want to equip, moving demand immediately.
- Cosmetic fashion cycles: trending loadouts (often streamer-driven) create short-lived buying waves.
- Event participation: tournaments and in-game events can pull players back, raising demand for related items.
- Seasonal cash flow: sales periods can redirect wallet balances, affecting discretionary cosmetic spending.
- Set completion pressure: when one missing piece becomes "the bottleneck," it can lead the move.
Mini-scenario: During a major sale, players allocate funds to games first, then cosmetics later. You may see a short dip followed by a rebound as wallets get topped up again-useful when interpreting steam market item price trends.
- Watch for: price rising alongside volume (healthier demand than price-only spikes).
- Watch for: repeated intraday rebounds after small dips (buyers defending a level).
Item Rarity, Float, and StatTrak: Quantifying Scarcity
Scarcity is easiest to trade when it is measurable. Many items have structured scarcity (rarity tiers) and granular scarcity (float ranges, patterns, special variants). Traders often misprice "rare within rare" attributes because the base item looks common on the surface.
Typical scenarios where quantified scarcity matters:
- Condition cliffs: the jump between adjacent wear tiers (e.g., from one condition bracket to the next) changes buyer willingness quickly.
- Low-float premiums: buyers pay more for top-percentile floats even if the name is identical.
- Special counters/variants: StatTrak (or equivalent) creates a separate demand pool with different liquidity.
- Pattern-driven collecting: specific pattern IDs become "micro-markets" inside a broader item.
- Discontinued or hard-to-mint sources: if the origin becomes inactive, effective supply tightens over time.
Mini-scenario: Two "same" skins show different prices. One has an attribute buyers filter for (very low float or a desired pattern). The public listing page may not scream "scarce," but the best offers vanish fast when collectors are active.
- Watch for: persistent premium for certain attributes despite stable base-item pricing.
- Watch for: thin listings at the premium tier (a few units control the market).
External Influences: Esports, Updates, and Real-money Trading

External shocks are why a clean "supply vs demand" story can break down day-to-day. Catalysts can create abrupt re-pricing, while constraints (fees, wallet rules, limited off-ramp) limit how far "pure arbitrage" can go.
Upsides of tracking external catalysts
- Faster thesis validation: you can explain a move quickly and decide whether it is durable.
- Earlier entries: esports moments and patch notes can lead price before most buyers react.
- Cleaner exits: catalyst-driven spikes often fade; recognizing the catalyst helps time selling.
Limitations and risks you must price in
- Policy friction: wallet constraints and trade restrictions can trap you in positions longer than planned.
- Hype decay: attention-driven demand can evaporate without warning.
- RMT distortion: off-platform cash trading can pull supply away from the market or create sudden dump waves, which a steam market price tracker may show as abnormal volume bursts.
Mini-scenario: A team's surprising tournament run makes a sticker/capsule theme trend. Prices spike, then soften once attention moves on. The trade is less about "fair value" and more about timing the attention curve.
- Watch for: price jump that starts within hours of a public catalyst (match result, patch).
- Watch for: volume surge that fades while price stays elevated (potential rug-pull risk).
Liquidity, Market Fees, and Price Floors
Many trading losses come from ignoring microstructure: how quickly you can enter/exit, and what fees do to breakeven. These mistakes are common when people ask how to make money on steam community market and assume gross moves equal profit.
- Myth: "If the chart goes up, I profit." Reality: fees and spread can erase small moves, especially on low-priced items.
- Mistake: trading illiquid items like liquid ones. Low listing depth means you may become the market when you buy or sell.
- Myth: "A stable price means low risk." Thin markets can be stable until one seller dumps inventory.
- Mistake: averaging down without a liquidity plan. You can lower cost basis but worsen exit capacity.
- Myth: "There is a real floor." Floors are often psychological and can break when supply waves hit.
Mini-scenario: You buy a niche cosmetic because it "never moves." Then one large inventory lists, undercuts, and resets the entire ladder. You're forced to wait weeks or sell into the dump.
- Watch for: shallow ladders (few listings near the current price).
- Watch for: wide gaps between price steps (higher slippage risk).
Early Trend Detection: Metrics, Alerts, and Pattern Recognition
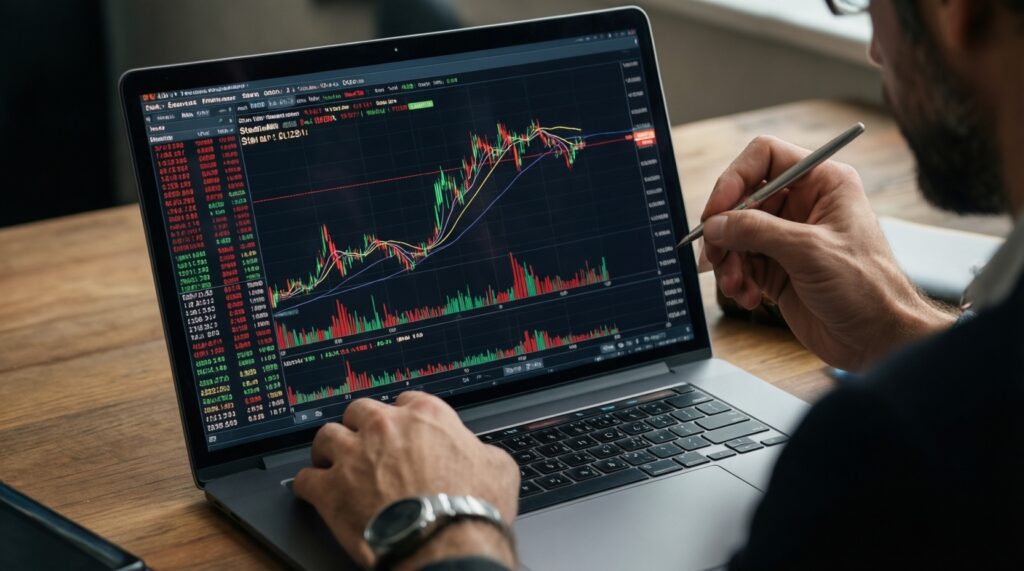
Early detection means turning market noise into repeatable signals. Use a steam market price tracker (or your own spreadsheet) to monitor a small set of metrics and trigger reviews when they shift together, not in isolation.
| Metric | What it tells you | Early bullish pattern | Early bearish pattern |
|---|---|---|---|
| Volume | Participation and urgency | Volume up with price up (buyers lifting offers) | Volume up with price down (distribution/dump) |
| Average price | Where trades actually clear | Rising average with stable listing count | Falling average despite "unchanged" listed price ladder |
| Volatility | Uncertainty and slippage risk | Volatility expands after a catalyst, then compresses while holding gains | Volatility expands with lower highs (failed pumps) |
| Listing depth | How much supply sits near current price | Depth thins near top of book (easier to push higher) | Depth thickens above (sellers stacking resistance) |
Mini-case (simple rule set): You monitor an item daily. If price rises but volume is flat, you treat it as fragile. If price rises with volume and listing depth near the current price shrinks, you treat it as a real move and look for an exit plan.
if (price_change > 0) and (volume_change > 0) and (listing_depth_change < 0):
    flag = "trend_strengthening"
elif (price_change > 0) and (volume_change <= 0):
    flag = "possible_spike"
elif (price_change < 0) and (volume_change > 0):
    flag = "sell_pressure"
- Watch for: alignment of signals (price + volume + depth), not single-metric excitement.
- Watch for: repeated higher lows on average price after catalysts (absorption pattern).
Mini-scenarios by situation (pick the one that matches your goal)
- Short flip (days): trade catalyst bursts; enter only when volume confirms, predefine exit into the next liquidity wave.
- Event hold (weeks): buy before an expected attention window; size smaller on thin listing depth to avoid being stuck.
- Collector positioning (months): focus on quantified scarcity (float/pattern/variant) where supply is structurally tight and less sensitive to daily hype.
- Arbitrage mindset (any horizon): compare spread, fees, and time-to-exit first; most "cheap" items are cheap because they are illiquid.
Self-check before you act (quick checklist)
- Can you explain the move with one clear driver (supply wave, demand pulse, or external catalyst)?
- Do volume and listing depth support the price move, or is it mostly noise?
- Is your exit realistic given liquidity and fee drag?
- Did you verify you're not confusing a rare attribute premium with the base item's market?
- Do you have a simple invalidation rule (what must happen for you to stop holding)?
Practical Questions Traders Ask About Price Movement
Why do steam community market prices differ from the "listed" price I see first?
The first visible listing is just the cheapest ask; it can be one unit. The more reliable signal is where trades actually clear (average price) combined with volume and listing depth.
What is the fastest way to read steam market item price trends without overreacting?
Check price direction, then confirm with volume and whether near-price listings are thinning or stacking. If only price moves, treat it as a possible spike until volume confirms.
Is using a steam market price tracker enough to trade profitably?
No-trackers show outcomes, not causes. You still need a thesis (supply/demand/catalyst) and an exit plan that accounts for liquidity and fees.
How do I think about how to make money on steam community market in a realistic way?
Focus on repeatable edges: trading into confirmed demand bursts, or buying quantified scarcity when supply is structurally tight. Avoid tiny-margin trades where fees and spread dominate.
Which steam market trading strategies are safest for intermediate traders?

Use rules-based entries (multi-signal confirmation) and small position sizes in thin markets. Prefer items with consistent volume so you can exit without moving the price.
What's a common false signal that traps buyers?
A sudden price jump with flat or falling volume is often just one buyer lifting thin listings. Without sustained volume, the move can reverse quickly once sellers appear.
How do I avoid getting stuck in an illiquid item?
Before buying, scan listing depth near the current price and imagine selling your full size without undercutting heavily. If you can't exit within a reasonable time window, reduce size or skip.